Multiple box plots
-
A box plot is a type of chart used to show how data is spread out. It uses the five-number summary (minimum, first quartile, median, third quartile, maximum) and outliers to give a clear picture of data dispersion and skewness. Matplotlib's plt.boxplot() function gives you a flexible way to draw box plots.
-
  import matplotlib.pyplot as plt
  import numpy as np

  data = [
      np.random.normal(10, 1, 100),
      np.random.normal(10, 1.5, 100),
      np.random.normal(10, 2, 100),
  ]

  plt.boxplot(data,
            patch_artist=True,
            showmeans=True,
            boxprops={'facecolor': 'pink', 'edgecolor': 'white'},
            whiskerprops={'color': 'pink', 'linestyle': '--', 'linewidth': 2},
            capprops={'color': 'pink', 'linewidth': 1},
            medianprops={'color': 'yellow', 'linewidth': 1},
            flierprops={'marker': '*', 'markerfacecolor': 'pink', 'markersize': 2})
  plt.title('Multiple box plots jjuni.com')
  plt.show()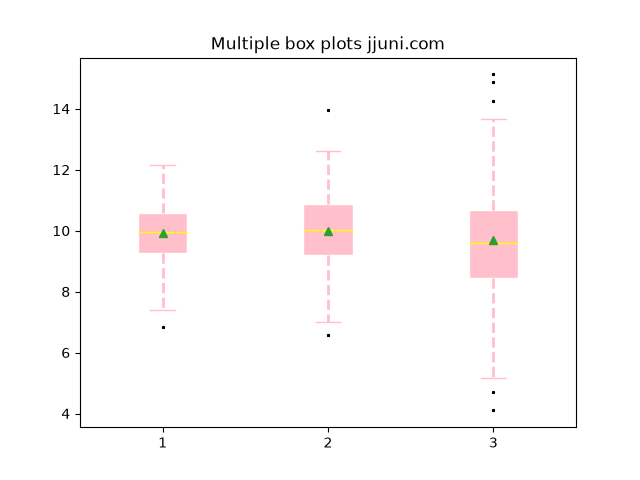
-